

Ceramic, metal, polymer materials and the contemporary three solid materials, ceramic products are applied in all fields of the national economy. Its development has experienced the process from simple and complex, from rough to fine, from oil free to glaze, from low temperature to high temperature. With the development of productive forces and the improvement of technical level, the meaning and scope of ceramics have changed in various historical stages. Common ceramics, natural clay as raw material, mixed forming, sintering. The development of production and the progress of science and technology make full use of the mechanical properties and physical and chemical properties of ceramic materials, thus producing many varieties, so that ceramics from the ancient craft and art field into the ranks of modern materials science. Engineering ceramics are made of high purity, ultra-fine synthetic materials, with precise control of chemical composition.
One of the basic characteristics of ceramic process is to form polycrystalline sintered bodies by forming and firing powders as raw materials. The particle composition of ceramic raw materials and ceramic mud is of great significance to the production of ceramic products. For example, the dispersion, fluidity, plasticity, dryness of raw materials and mud, the density, strength, firing characteristics, lacticity and so on are closely related to the particle composition. The quality of ceramic powder as starting material directly affects the quality of final product.
With the development of science and technology and the advancement of industrialization, various analytical instruments, detection methods and techniques have been developed.
1.Sieving method
Sieving method is the most traditional and the simplest method to test powder size. The screening method is to separate particle samples into several particle grades through a series of standard screens with different sieve diameters by means of manual or different mechanical vibration devices, and then weigh them respectively. Finally, the particle size distribution represented by mass fraction is obtained. Screening methods are divided into dry screening and wet screening. Dry screening method should pay attention to prevent particle agglomeration, can use hand shaking, mechanical or ultrasonic vibration methods to strengthen the dispersion of samples; Wet sieve method is often used in liquid particles or dry sieve when easy to form fine powder, brittle powder is also best to use wet sieve method.
Advantages: screening method has the advantages of simple equipment, low cost, simple operation, intuitive results, large sample size, strong representation and so on.
Disadvantages: the uniformity of mesh size and the wear degree of the screen will affect the test results of the screening method, the mesh is not uniform, the size is not the same, will lead to the accuracy of the test results; Loose mesh and larger mesh will lead to finer test results. In addition, the test results of screening method are also easily affected by environmental temperature, operating techniques and other factors. At present, the screening method is mainly suitable for the test of large particle size of powder.
2.Sedimentation method
The sedimentation method is based on the sedimentation rate of ceramic particles with different particle sizes in liquid to detect the particle size distribution of powder. The test process is to add the sample to a liquid to make a suspension of a certain concentration. The particles in the suspension will settle under the action of gravity or centrifugal force. The sedimentation rate of particles with different sizes is different, and the particle size is tested by the sedimentation rate of particles. The relationship between particle sedimentation rate and particle size is subject to Stokes' law, that is, powder particles suspended in medium settle according to Stokes' formula principle. The relationship between particle sedimentation rate V and particle size of powder can be shown as follows: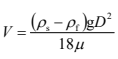 (g is the acceleration of gravity; ρs is the sample density; ρf is the medium density; μ is the viscosity coefficient of the medium. The sedimentation rate is proportional to the particle size and density, and inversely proportional to the viscosity of the medium.)
Advantages: intuitive principle, high resolution, low price and operating cost.
Disadvantages: The measurement speed is slow and can not handle mixtures of different densities. The results are greatly affected by environmental factors (such as temperature) and human factors.
3.Fisher's method

Figure 1: Schematic diagram of particle size test of powder by Fei Clan instrument
Fisher's method is a laminar flow gas transmission method. It is used to calculate the average particle size and specific surface area of powder by using the resistance and flow rate generated when air passes through powder accumulation body. The mean particle size (D) equation of Kozeny-Carman powder was derived from the specific surface area equation and the porosity equation: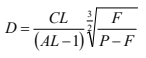 (Where: P and F are the pressure before and after the air passes through the powder; A represents the cross-sectional area of powder extrusion body (unit: cm³); L represents the thickness of powder accumulation body (unit: cm); C is the instrumental constant.)
FIG. 1 shows the schematic diagram of testing ceramic powder particle size by Fischer method. The instrument has simple structure, convenient operation and low testing cost, and can read the particle size directly from a special reading board. It is important to note that the measurement should first find the optimal porosity, and then measure the particle size of the powder under this porosity.
4.Laser method
When a light beam hits a fine particle in a gas or liquid, the light scatters in all directions, creating a momentary shadow behind the particle. Some of the light is absorbed by the particle, and some is diffracted. The scattering and diffraction of light are related to the particle size. Laser particle size analyzer uses the diffraction and scattering phenomenon and diffraction principle generated by laser irradiation of appropriately dispersed particles, the instrument uses a specially made large-scale integrated circuit detector, from the figure 1: The laser particle size analyzer has the characteristics of fast analysis speed, simple and convenient operation, and wide detection range. It has been developed rapidly in recent years.
Figure 2 shows the basic schematic diagram of laser particle size analyzer. After the laser sends out a monochromatic light and expands the beam by filtering, it becomes a parallel monochromatic light beam and illuminates the sample groove containing the suspension to be measured. The light scattered by particles is concentrated on the photodetector located in its focusing plane through the Fourier conversion lens, and the photodetector converts the light intensity it receives into electrical signal output. After amplification and analog-digital conversion, the particle size distribution of ceramic powder is obtained by computer.

Figure 2: Basic schematic diagram of laser particle size analyzer
Advantages: Wide test range (the measuring range of the best laser particle size analyzer is 0.04~2000 m, generally can reach 0.1~300 m), fast test speed (1~3 minutes/time), high degree of automation, simple operation, good repeatability and authenticity, can test dry powder samples, can also measure mixed powder emulsion and fog drops, etc.
Disadvantages: It is not suitable to measure samples with very narrow particle size distribution, and the resolution is relatively low.
5.Microscopic method
In this method, the sample needs to be placed on a slide, and the plane projection image of the particle is directly observed and measured by imaging method, so as to measure the particle size. The electron microscope can determine the projected area of each particle, and the lower limit of particle size can be 0.001μm or smaller.
Advantages: not only can understand the size of the particles, but also can understand the shape of the particles, structural status and surface morphology. It is a practical measurement method that can be used to test and calibrate the results of other measurement methods.
Disadvantages: Expensive instrument, tedious sample preparation, limited sample quantity.
6.Image method
Image analysis technology is a method to measure particle size, geometric shape and morphology, which can characterize all defined particle size and morphology parameters in one measurement. Execution standards for measurement, description and validation methods, including GB/T 21649.1 and ISO 13322-2.
Particle Shape is an enveloping surface composed of all points on its surface. morphology extends this simple shape description to complex descriptions, such as porosity, roughness and texture characteristics. Grain shape is the general term for particle shape and morphology. The technique is a zoomable microscopic imaging technique that directly measures particle size and morphology, and has been developed into a cutting-edge technique that quantifies a large number of particles to ensure statistical confidence in the final results of particle size and particle shape. This technique has no theoretical hypothesis, only the definition of the particle, so it can accurately reflect the real particle size and particle size distribution of the sample, and can carry out accurate quantitative analysis of the particle morphology, and give the grain shape distribution map. Therefore, this method can not only replace scanning electron microscope, but also replace laser particle size analyzer. Multiple results can be obtained in one experiment, and the data amount is extremely rich, including three levels (particle size, particle shape). Particle count), a lot of information.
With the rapid development of optics and information science and technology, the latest image method, which combines the visual observation and measurement method of image with statistics, can not only obtain the visual information of individual particles, but also obtain the statistical information of particle size and morphology of a large number of samples, so as to help users to comprehensively characterize the samples.
1.R-3000 Product Principles
R-3000 is a highly innovative particle size and shape analyzer, using static image analysis test method, advanced vision technology and patent vacuum dispersion technology organic combination, can be in a short time, the imaging analysis of tens of thousands of particles, to determine the particle size and shape information, suitable for a variety of dry powder particle size and shape analysis. (Figure 3)

Figure 3: Schematic diagram of R-3000
2.R-3000 product features
(1) Innovative vacuum dispersion technology to achieve good dispersion of small to sub-micron samples
(2) Using the image square telecentric automatic magnification lens, no need to convert the lens, can realize the switch of different magnification imaging
(3) Static particle image analysis, particle orientation is consistent, more accurate test results
(4) Automatic planning of test path of scattered surface to avoid particle reshooting
(5) Ultra-high imaging resolution can realize the test of sub-micron particles, with the lower limit up to 0.3μm
(6) Up to more than 30 kinds of particle size and shape parameters, can achieve a variety of filter Settings, can quickly classify particles
(7) All particles are automatically saved, and specific particles can be selectively exported
(8) A variety of statistical data forms: bar chart, curve chart, box chart, scatter chart, etc., can be used for horizontal comparison of the same type of parameters, can also be used for correlation analysis of different types of parameters
(9) The test sample can be 100% recycled
3.R-3000 samples were dispersed
Innovative vacuum dispersion technology to achieve good dispersion of small to sub-micron samples
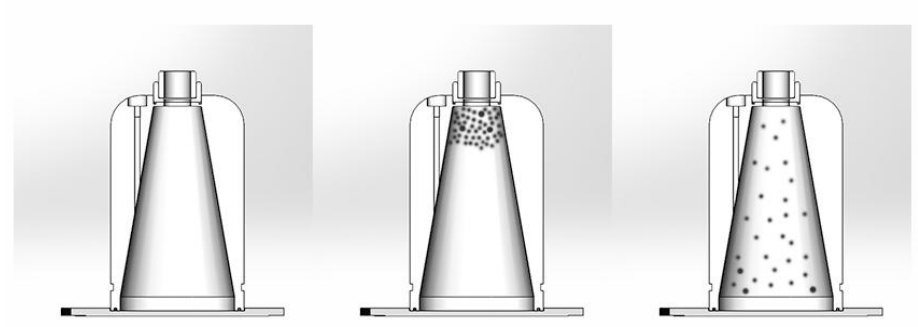
Figure 4: Sample dispersion diagram
Using an innovative vacuum dispersion technique (FIG. 4), the sample particles were dispersed on a slide on the sample table and analyzed by autozoom microscanning (FIG. 5) for still images. Instrument composition includes: particle dispersion area, particle measurement area, industrial digital cloud eye camera, aberration-free telecontrol lens, Figure 3: R-3000 principle diagram short-wavelength monochromatic light source, built-in vacuum pump and sample dispersion system, built-in computer and professional control and analysis software. The software can distinguish particles from the background, measure various particle size and particle shape parameters for each particle, and report the results.

Figure 5: Original sample particle
4.R-3000 Product report analysis
This product has three report templates: filter report, comprehensive report and standard report. You can choose different report templates according to your needs.
Screening report
After setting the desired parameter conditions, the number and proportion of particles satisfying this parameter or several parameters can be obtained in the particle classification statistics of the screening report. For example, the fraction of the equivalent area diameter (Figure 6) can be obtained quickly by using this feature, and the spheroidization rate can be obtained directly from this report (Figure 7).
Screening report

图六:等效面积直径分段占比
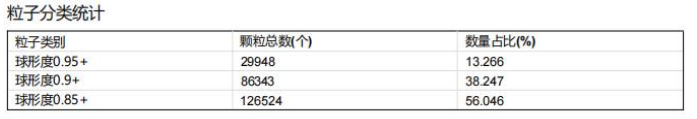
Figure 7: spheroidization rate
Comprehensive report
The content of the comprehensive report includes more than 30 parameters of the grain size distribution map, particle image, scatter map and multi-report comparison chart.
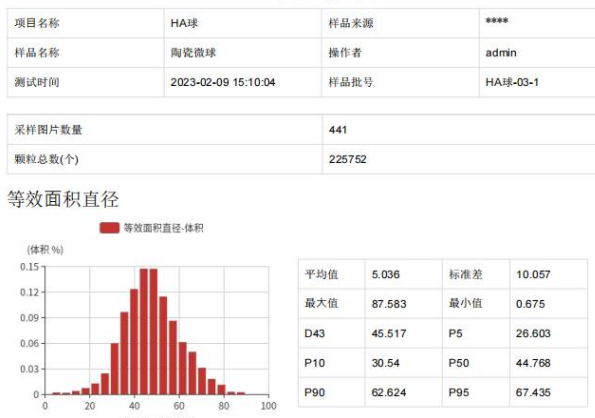
Figure 8: Synthesize part of the grain size chart in the report
The particle size parameter generally uses the volume proportion. The figure can directly see the distribution of the particle shape parameter of the sample particles, and the table can directly obtain the information of P10, P50, P90 (same as D10, D50, D90 of the laser particle size meter). Grain shape parameters generally use the number of proportion, it is worth mentioning that R-3000 not only has such parameters as aspect ratio, concave, roundness, and some of its unique parameters, such as: satellite index and bluntness.
Bluntness (FIG. 9) is the best parameter to characterize particle sphericity in two-dimensional particle shape parameters, and it is related to the ratio between the curvature of particle boundary and the maximum tangent circle. Only perfect circles achieve a bluntness index of 1, while lower values, especially below 0.5, represent a very irregular (rough) profile.

Figure 9: Bluntness of grain-size graphs
Satellite powder refers to the very small ball and the larger ball together produced by irregular particles, which can not be characterized by macro and mesoscopic particle shape parameters, the need for more detailed description of the micro particle shape, to analyze the degree of satellite powder discharge.

Figure 10: The satellite index of the comprehensive report grain size graph
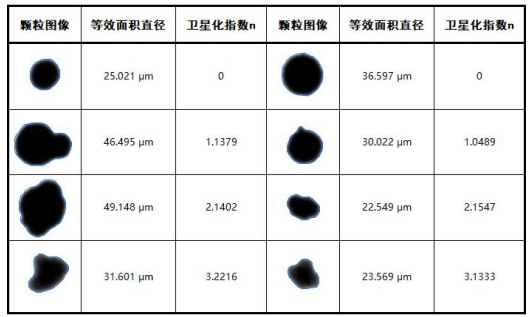
Figure 11: Map of particle adhesion corresponding to satellite index
The comprehensive report can also show the morphologies of some large particles selected by users and their corresponding equivalent area and diameter size, and it can be clearly seen whether the large particles are agglomeration, adhesion or impurities.

Figure 12: Granular image
According to the comparison of particle shape parameters of different particle sizes in the horizontal and vertical coordinates, we can get the sample particle diagram in graphic form (i.e., scatter diagram), so that we can see the particle morphology more directly. Meanwhile, by comparing different parameters in the horizontal and vertical coordinates, we can see the distribution of particles. As shown in Figure 12, the particles in the figure are located at the edge of the scatter plot. The equivalent area diameter of the particles is 84.6μm, and the roundness is 0.908.

Figure 13: Scatter plot
Repeatability and reproducibility are the most fundamental basis for judging the reliability of measurement results. Repeatability refers to one sample and multiple measurements, while reproducibility refers to the same sample, the same measurement conditions and different times of sampling. The multireport comparison graph intuitively shows us the accuracy of the data.
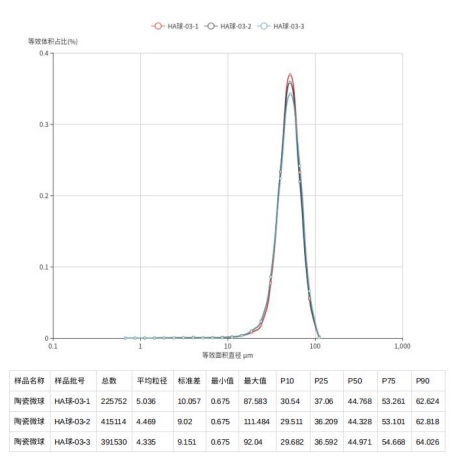
Figure 14: Reproducibility test report of multiple report comparison graphs
In addition, the multi-report comparison chart can also make horizontal comparison of the same parameter of different samples, from which we can get the particle size distribution of different samples. The size of sample particle D50 can be intuitively compared by drawing the graph based on the volume distribution, and the proportion of size particles can be clearly understood by drawing the graph based on the quantity distribution.

Figure 15: Equivalent area diameters of multireport comparison plots
Grain shape and granularity are also important, and multi-report comparison charts can also be used to compare the same grain shape parameter. In general, the number proportion is used as the ordinate of particle shape parameters. From the chart, we can know which sample's roundness or sphericity is closer to 1.

Figure 16: Roundness and sphericity of multiple reports

Innovative particle characterization creates infinite possibilities

Pay attention to M.I.P